BJ's Wholesale Club Holdings, Inc. BJ
Fundamental and Technical Analysis before Earnings Release
BJ's Wholesale Club Holdings, Inc. (NYSE: BJ) is scheduled to release its fourth quarter fiscal 2024 earnings on Thursday, March 6, 2025, before the market opens. The company will also hold a conference call on the same day at 8:30 a.m. ET to discuss its financial performance.
Investors and analysts will be looking closely at these results, as BJ's Wholesale Club has recently reached a milestone of 7.5 million members and announced plans for a membership fee increase. The company has also raised its fiscal 2024 guidance, expecting fourth quarter fiscal 2024 comparable club sales, excluding the impact of gasoline sales, to increase 2.5% to 3.0% year-over-year.
In this analysis, we examine Kroger from both fundamental and technical perspectives. Fundamenatal and technical analysis before an earnings release can provide valuable insights, but it's important to approach it with caution due to the potential for increased volatility. Increasing volatility in the market can potentially enhance profit opportunities for traders.
Trade policies and tariffs
Furthermore, as a wholesale club that imports various products, any changes in trade policies or tariffs could potentially impact their costs and pricing strategies. Investors may want to listen for any comments on this topic during the earnings call.
Fundamental Analysis of BJ
BJ's Wholesale Club Holdings, Inc. (NYSE: BJ) is a leading membership-based warehouse club chain in the United States. Here's an overview of the company's recent performance and key developments:
Financial Performance
Q3 2024 Results:
Net sales increased 3% year-over-year to $4.98 billion
Net income rose to $155.7 million, up from $130.5 million in Q3 2023
Adjusted earnings per share grew 18% to $1.18
Comparable club sales increased by 1.5%, with a 3.8% increase excluding gasoline sales
Fiscal 2024 Guidance: The company has raised its guidance for fiscal 2024, indicating confidence in its performance
Membership and Expansion
Membership Growth: BJ's reached a milestone of 7.5 million members
New Locations:
Opened three new clubs and four new gas stations in Q3 2024
2025 Locations:
Hanover Township, New Jersey: This will be BJ's 25th club in New Jersey.
Southern Pines, North Carolina: Marking BJ's 10th location in North Carolina.
Louisville, Kentucky: BJ's first location in Kentucky, marking its entry into its 21st state. This location will include a BJ's Gas station
Strategic Initiatives
Membership Fee Increase: Announced plans to increase membership fees, the first such increase in 7 years
Digital Growth: Digitally enabled comparable sales grew 30% year-over-year in Q3 2024
Share Repurchase: Board approved a new $1 billion share repurchase program
BJ's Wholesale Club continues to demonstrate strong performance, with robust membership growth and expansion into new markets. The company's focus on digital sales and strategic initiatives like the membership fee increase suggest a proactive approach to maintaining growth and profitability in the competitive wholesale club sector.
Technical Analysis of BJ
Daily Chart
Weekly Chart
Moving Averages
8-day EMA: $101.31, is above the stock price, it generally indicates a short-term downtrend or bearish momentum in the stock
20-day EMA: $101.77, also bearish
The 50-day EMA at $99.29 is slightly below the current price, it generally indicates a midly bullish trend in the market.
100-day SMA: $94.46, it indicates a bullish trend in the medium term.
200-day SMA: $89.85, it indicates a bullish trend in the long term.
Oscillators and Momentum
The Relative Strength Index (RSI) (14,70,30)
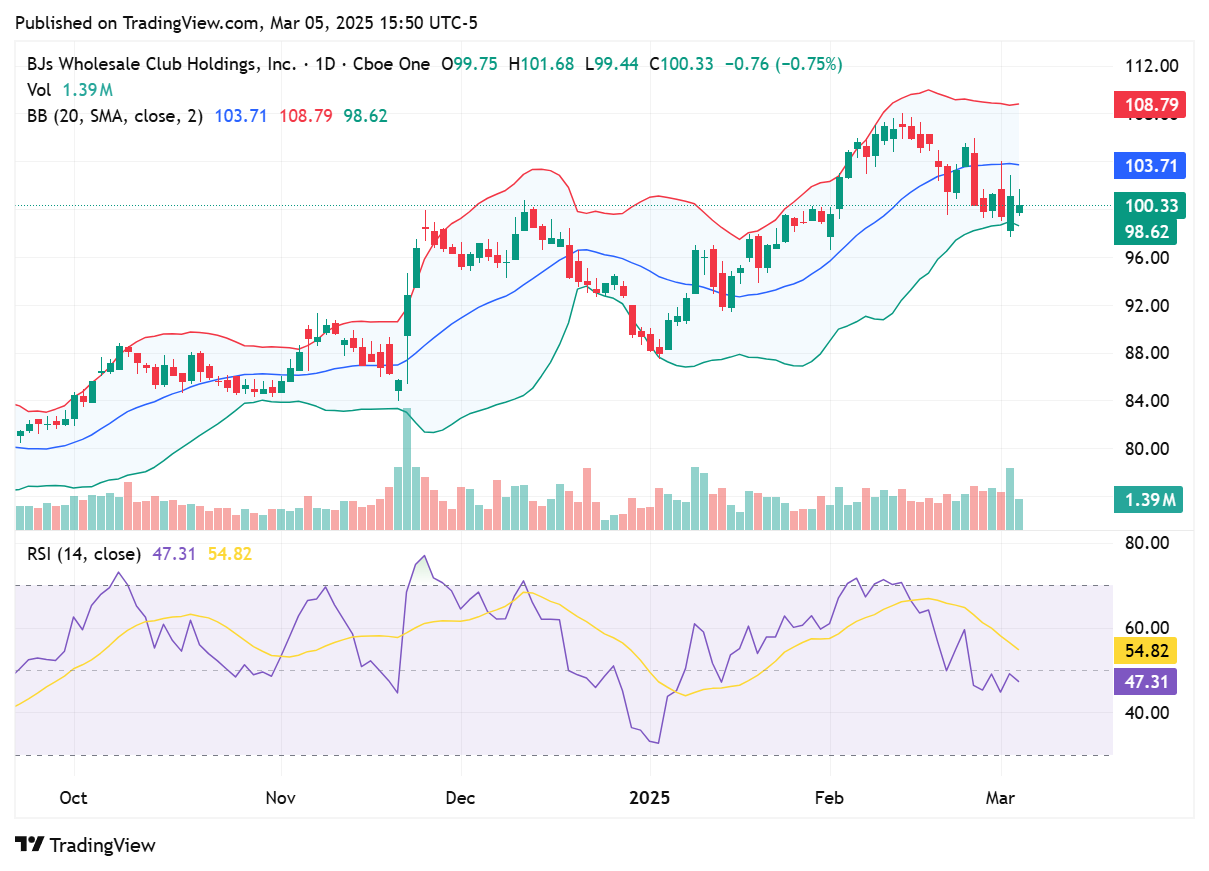
Daily: 47.31, indicates that the asset is currently in a neutral zone, slightly leaning towards bearish sentiment
Weekly: 59.18,indicates a moderately bullish sentiment in the medium-term
The Moving Average Convergence Divergence (MACD) (12,6,9)
Daily: 0.2715, indicates a bullish signal in the short-term
Weekly: 4.3862, indicates a bullish trend.
The Commodity Channel Index (CCI) (14,-100,100)
Daily: -80.851, indicates that the asset is approaching oversold conditions, but hasn't yet reached the standard oversold threshold
Weekly: 50.68, indicates a moderately bullish sentiment
Price Action and Volatility
Bollinger Bands
(Daily) : 98.62; 103.71; 108.79. The stock is experiencing downward pressure but hasn't reached oversold conditions yet.
Bollinger Bands (Weekly): 83.83; 95.49; 107.16, the price moving above the middle band indicates that the stock is showing strength and potentially trending upwards.
Percent B (%b):
Daily: 14.77, indicating potential oversold conditions
Weekly: 69.81, suggests bullish momentum, as the price is well above the middle band
Bandwidth:
Daily : 10.17, indicates a moderate level of volatility
Weekly: 23.33, the Bollinger Bands are widely separated, indicating a strong trend or recent large price movements.


