

Daily Newsletter 5/14/25

The inflation data released yesterday suggest that inflation pressures are easing, despite ongoing concerns about the impact of tariffs and some categories such as shelter and energy still seeing increases.
The market reaction to the report was muted, with equities and Treasury yields showing little movement, reflecting that the data was largely in line with expectations and did not provide a strong signal for immediate changes in monetary policy.
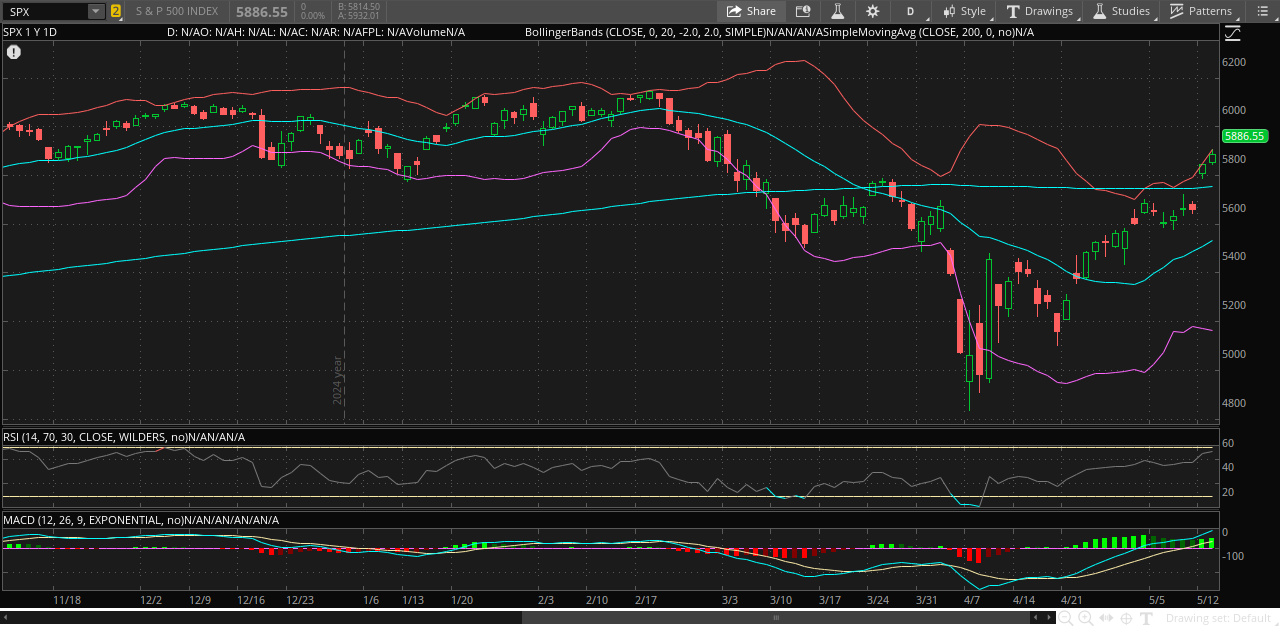
SPX reacted with a sharp rally, reflecting renewed risk appetite and optimism that the worst of the trade tensions may be over, at least in the near term. However, analysts note that risks remain if negotiations stall or if inflationary pressures from tariffs persist.
The S&P 500 (SPX) is currently exhibiting a bullish trend in the short to medium term.
We remain unconvinced that this rally will be sustained, at least until there is greater clarity and the markets are confident that uncertainty has truly subsided.
76% of S&P 500 stocks are trading above their 20-day Simple Moving Average (SMA)
69% of S&P 500 stocks are trading above their 50-day Simple Moving Average (SMA)
49% of S&P 500 stocks are trading above their 200-day Simple Moving Average (SMA)
Being above the 20 SMA and 50 SMA suggests the stock is experiencing bullish momentum in the short and intermediate term. This typically signals that recent price action is positive and buyers are in control over these time frames.
However, 51% trading below the 200-day SMA indicates the longer-term trend is still bearish or has not yet turned positive. The 200-day SMA is widely regarded as a dividing line between bull and bear markets; remaining below it means the stock has not fully reversed its broader downtrend.
Relative Strenght Index (RSI)
6% of S&P 500 stocks are trading below 30 (O/B)
44% of S&P 500 stocks are trading above 70 (O/S)
The market is showing broad strength and bullish momentum, with many stocks in overbought territory. However, such a high percentage of overbought stocks can also signal that the market is becoming stretched and may be vulnerable to short-term consolidation or a pullback as some investors take profits. The very low percentage of oversold stocks further confirms the lack of broad selling pressure at this time.

The U.S.-China trade agreement initially pushed Treasury yields higher as risk appetite improved and safe-haven demand waned. Yields then stabilized and edged lower as investors balanced the positive trade news with subdued inflation data and ongoing uncertainty about the longer-term economic impact of tariffs and Federal Reserve policy.
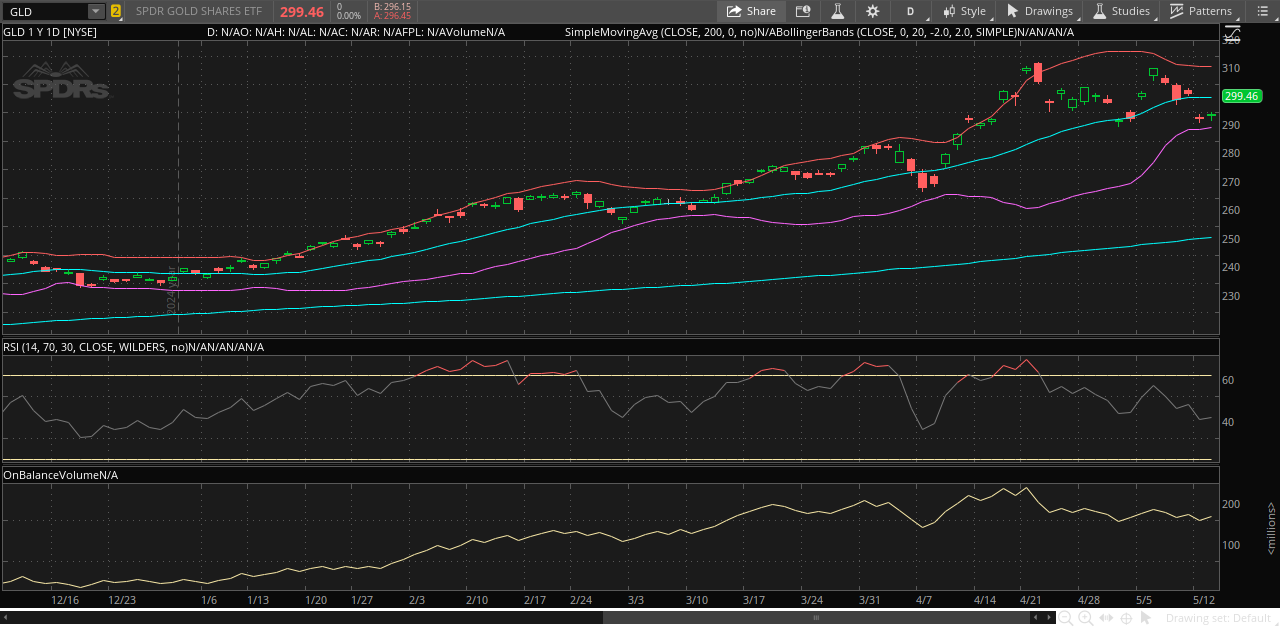
The SPDR Gold Trust (GLD), which tracks the price of gold, fell sharply following the announcement of the U.S.-China trade agreement that temporarily reduces tariffs.
GLD and other gold-related ETFs experienced notable outflows as investors rotated toward assets expected to benefit from improved economic prospects and reduced geopolitical uncertainty.

Oil prices responded with a sharp rally to the U.S.-China trade agreement, reflecting optimism for stronger demand and reduced recession risk. The sustainability of these gains will depend on the durability of the trade truce and the balance between rising supply and recovering demand.
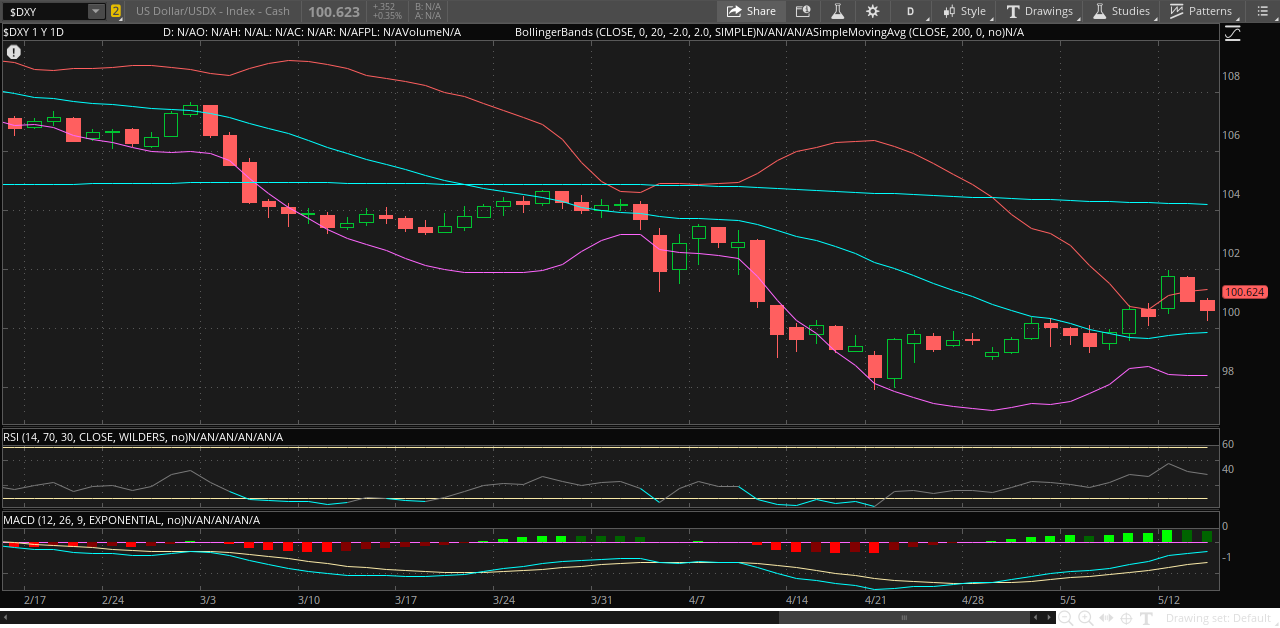
The dollar’s immediate reaction to the U.S.-China trade agreement was a strong rally.
Market sentiment has shifted sharply positive in recent days. After a period of deep pessimism-driven by concerns over tariffs, inflation, and recession risk-investors have turned more optimistic as several key factors aligned. These events can be seen as a bear market correction rather than the start of a sustained rally, as concerns about overexposure to U.S. assets and ongoing trade uncertainties may limit further gains.The direction, we think, will reveal itself in the near future.
OUR TRADES
Below, you will find our portfolio, which is divided into two sections: the Tactical Portfolio and the Medium-to-Long-Term Portfolio.
We share all entry and exit points of our tactical trades with our paid subscribers, along with detailed explanations for why each trade was initiated.
Our service provides comprehensive macroeconomic and financial analysis, as well as educational resources designed for anyone eager to deepen their understanding of the markets and the economy.
If you found this post valuable, we encourage you to become a paid subscriber.
Keep reading with a 7-day free trial
Subscribe to MacroXX to keep reading this post and get 7 days of free access to the full post archives.