

Daily Newsletter 5/30/25

The Bureau of Economic Analysis is set to release the April PCE data today at 8:30 AM EST.
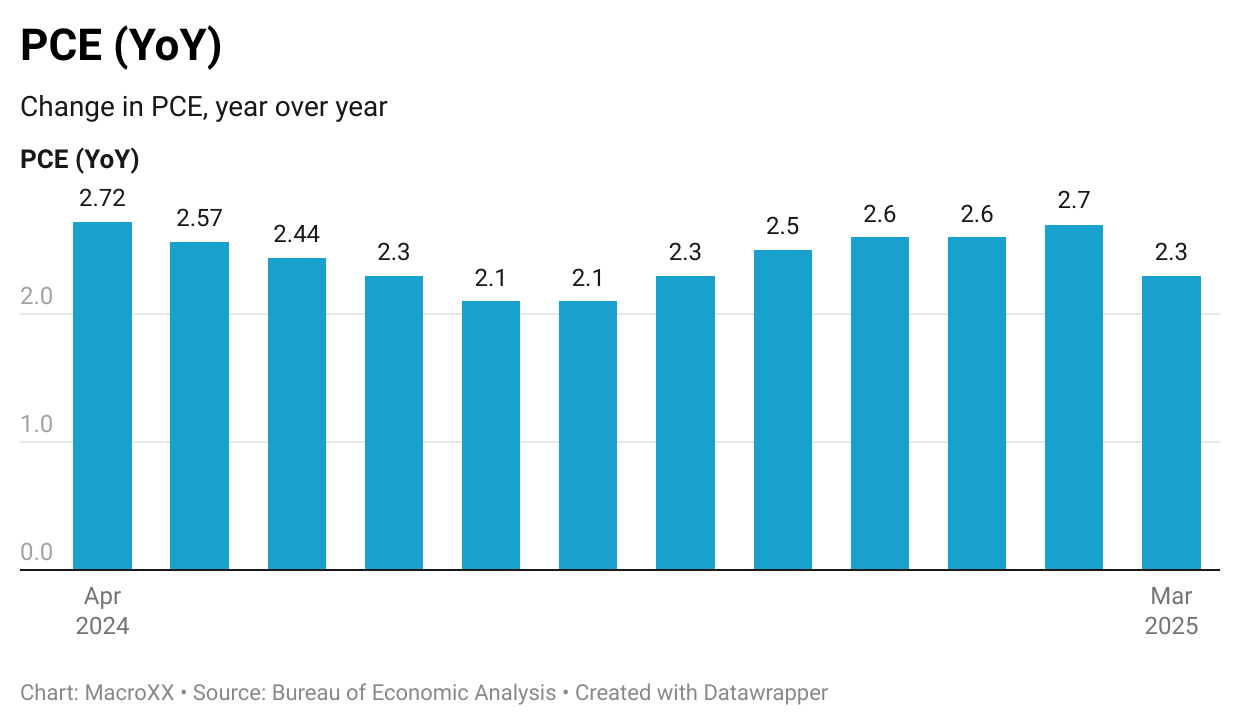
PCE data tracks how much U.S. consumers spend on goods and services, which accounts for about two-thirds of domestic spending and is the primary driver of economic growth. It is the Federal Reserve’s preferred measure of inflation, helping policymakers assess price stability and set interest rates.
To what extent does PCE data matter?
By analyzing PCE trends, we can determine the state of the economy and project its future trajectory.
Before we proceed, let’s take a moment for a brief sub-section in our post, then continue our exploration of the bigger picture.
From Raw Data to Insight: Evaluating Official Statistics for Robust Macro Analysis
Official data means information collected and published by government or authorized agencies for public use, supporting decisions and policies in areas like economics, society, demographics, and the environment.
Below is a brief overview of the official statistics most frequently used.
Bear in mind that there are other indicators available; however, the following list highlights the most frequently utilized ones.
Gross Domestic Product (GDP): Measures the total value of goods and services produced within a country’s borders, published by agencies like the U.S. Bureau of Economic Analysis.
Inflation Rates (Consumer Price Index, CPI): Tracks changes in the price level of a basket of consumer goods and services, published by the Bureau of Labor Statistics and the Federal Reserve.
Unemployment Rate: Measures the percentage of the labor force that is jobless and actively seeking employment, published by the Bureau of Labor Statistics.
Personal Income and Consumer Spending: Data on household income and expenditures, released by the Bureau of Economic Analysis.
Retail Sales, Construction, and Housing Data: Indicators of economic activity in specific sectors, published by the U.S. Census Bureau.
International Trade Balances: Data on imports and exports, also from the U.S. Census Bureau and international organizations.
Government Budget Deficits/Surpluses and Public Debt: Fiscal indicators published by the U.S. Department of the Treasury and international bodies.
Exchange Rates and Interest Rates: Financial indicators published by central banks and the Federal Reserve.
Are official economic data flawless?
Our answer to this question is straightforward: No, official data are not perfect. It’s crucial to recognize that no single economic indicator is flawless, and none should be relied upon exclusively. For investors, this means forecasts should never be based on just a handful of indicators. At the same time, simply adding more variables doesn’t guarantee improved predictions. When assessing market directions, it’s wise to remember that there are no perfect indicators—just as there is no trading system that works flawlessly every time.
While we depend on official data alongside other sources, we’d like to highlight some of the most common flaws we encounter with official statistics.
Data Revisions and Lags: Official statistics are often subject to revisions as more complete information becomes available, and there can be significant lags between data collection and publication. Timeliness is the main concern. Some data often lose their relevance by the time they are released to the public. Additionally, revisions can diminish the significance of the data.
Potential for Political Influence: There are concerns about political interference or changes in methodology that could undermine the objectivity of official statistics.
Methodological Limitations: The complexity of seasonal adjustments, differences in collection methods, and sample sizes can introduce errors or bias.
Survey Response Rates: Declining participation in government surveys—such as those used to calculate unemployment and consumer spending—can reduce the representativeness and reliability of the data.
Budget and Staffing Constraints: Shrinking budgets and reduced staff at statistical agencies can further threaten the quality and timeliness of economic data.
To summarize our approach to official data: treat them as valuable supplements to your analysis, but never rely on them in isolation. Depending solely on macro data is one of the most significant mistakes an investor or analyst can make. Ultimately, macroeconomics isn’t just about seeing the big picture—it’s mostly about understanding how all the different parts of the economy interact and influence each other.
Big picture:
How does PCE data fit into the broader economic landscape?
While there was a notable decline in the March figures, those numbers did not fully capture the effects of recent tariffs. The upcoming April data will provide a clearer—though still incomplete—view of price trends in the U.S. economy.
Let’s begin with a theoretical perspective: when PCE prices decline, the Federal Reserve is typically more inclined to lower interest rates. However, in today’s complex economic environment, the Fed’s actions are not as purely data-driven as they may assert. While the Federal Reserve is an independent public institution, it would be naive to ignore the potential influence of the political landscape on its decision-making.
Even if we assume the Federal Reserve’s decisions are entirely data-driven, the lack of timely information and uncertainty about how tariffs might fuel inflation—along with the lag in official data—means that PCE data remains important. However, this single number alone does not carry overwhelming significance over the medium term. While today’s PCE release could move markets in either direction in the short run, we believe that regardless of whether the market reaction is bullish or bearish, it will not have a substantial long-term impact.
Beyond official data, what truly shapes the big picture is how the ongoing legal tariff battle in the U.S. unfolds, how other markets and economies respond, and whether there will be an immediate reaction. Also important is how bond vigilantes choose to express their views, and how markets process NVIDIA’s earnings release—especially after already witnessing significant changes on the first trading day.
Markets have been on a rollercoaster recently, and we expect this volatility to persist for some time. Brace for continued ups and downs.
OUR TRADES
Below, you will find our portfolio, which is divided into two sections: the Tactical Portfolio and the Medium-to-Long-Term Portfolio.
We share all entry and exit points of our tactical trades with our paid subscribers, along with detailed explanations for why each trade was initiated.
Our service offers in-depth macroeconomic and financial analysis, along with educational resources tailored for those looking to expand their knowledge of the markets and the economy.
If you found this post helpful, we invite you to join us as a paid subscriber.
Subscribers gain access to our tactical trade ideas, allowing you to track our portfolio and make informed decisions as you build your own.
