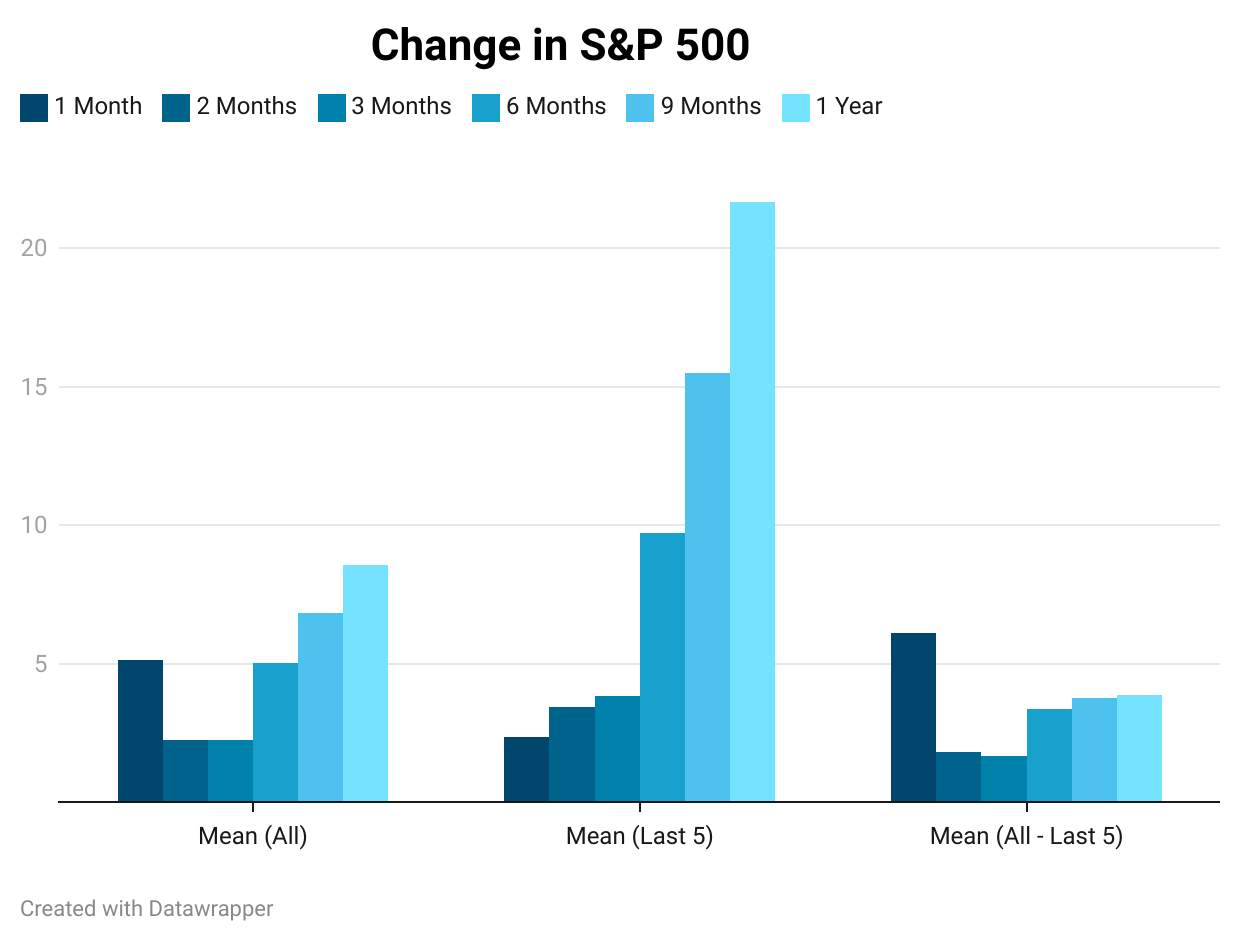
The market performance data used in this study go all the way back to 1945.
Please note that past performance is not a strong indicator of future stock market performance.
One Year after US Presidential Elections since 1948. Change in %.
The historical pattern for elections since 1948 shows:
High percentage increases in the first month after the election
Lower returns in the second and third months
Six-month returns similar to one-month returns
However, the last five elections (2004-2020) present a different picture:
Consistently increasing returns throughout the first year
Significantly higher one-year average return (21.66%) compared to the all-elections average (8.56%)
This divergence suggests a potential shift in market behavior following more recent elections.
S&P 500 follows a clear pattern during the first year after elections when we consider all elections since 1948. High percentage increases in the first month, second and third months returns are lower than the ones from the first mo…