KROGER Co KR
Fundamental and Technical Analysis before Earnings Release
Kroger (NYSE:KR) is expected to release its fourth quarter 2024 earnings report on Thursday, March 6, 2025, before the market opens. The company will host a conference call with investors at 10:00 a.m. ET on the same day to discuss the results.
The company has a market capitalization of approximately $45.72 billion, making it a large-cap stock. Kroger operates a significant number of supermarkets and multi-department stores across the United States, employing over 414,000 people.
In this analysis, we examine Kroger from both fundamental and technical perspectives. Technical analysis before an earnings release can provide valuable insights, but it's important to approach it with caution due to the potential for increased volatility. Increasing volatility in the market can potentially enhance profit opportunities for traders.
Fundamental Analysis of KR
Kroger operates in the Consumer Defensive sector, specifically within the Grocery Stores industry. As one of the largest retailers in the world, Kroger's business model and market position provide several key insights into its sector performance and outlook:
Market Position
Kroger maintains a strong presence in the U.S. grocery retail market, with approximately 45% of the U.S. population within reach of a Kroger store. This extensive network of 2,716 supermarkets, including 2,252 with pharmacies and 1,613 with fuel centers, positions Kroger as a one-stop-shop for consumers.
Competitive Landscape
The grocery retail sector is highly competitive, with Kroger facing pressure from various fronts:
Traditional competitors: Walmart remains a formidable rival, often offering lower prices to budget-conscious consumers.
Discount retailers: Chains like Aldi and Lidl are expanding, intensifying competition.
Specialty grocers: Whole Foods and Sprouts Farmers Market cater to niche markets.
E-commerce giants: Companies like Amazon are increasingly entering the grocery space
Kroger reported its third quarter 2024 results on December 5, 2024, showing mixed performance:
Financial Highlights
Total sales: $33.6 billion, down from $34.0 billion in Q3 2023
Identical sales without fuel: Increased 2.3%
Operating profit: $828 million
Earnings per share (EPS): $0.84
Adjusted EPS: $0.98, up 3% year-over-year
Key Performance Indicators
Digital sales growth: 11%
Our Brands sales growth outpaced total grocery sales growth
Increased total households and loyal households
Factors Affecting Results
Sale of Kroger Specialty Pharmacy on October 4, 2024, for $464 million, reducing Q3 sales by approximately $340 million
Lower fuel sales due to lower average retail price per gallon compared to last year
Technical Analysis of KR
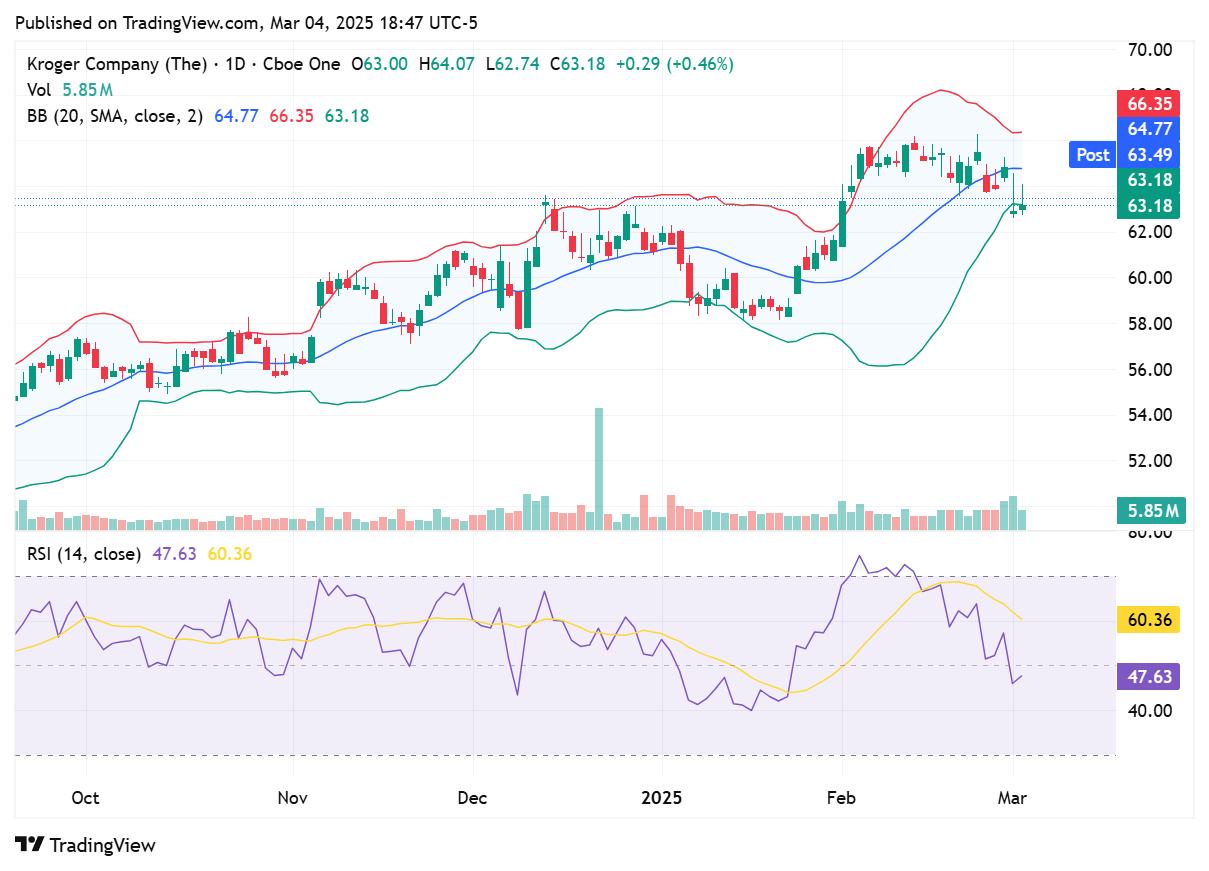
Daily Chart
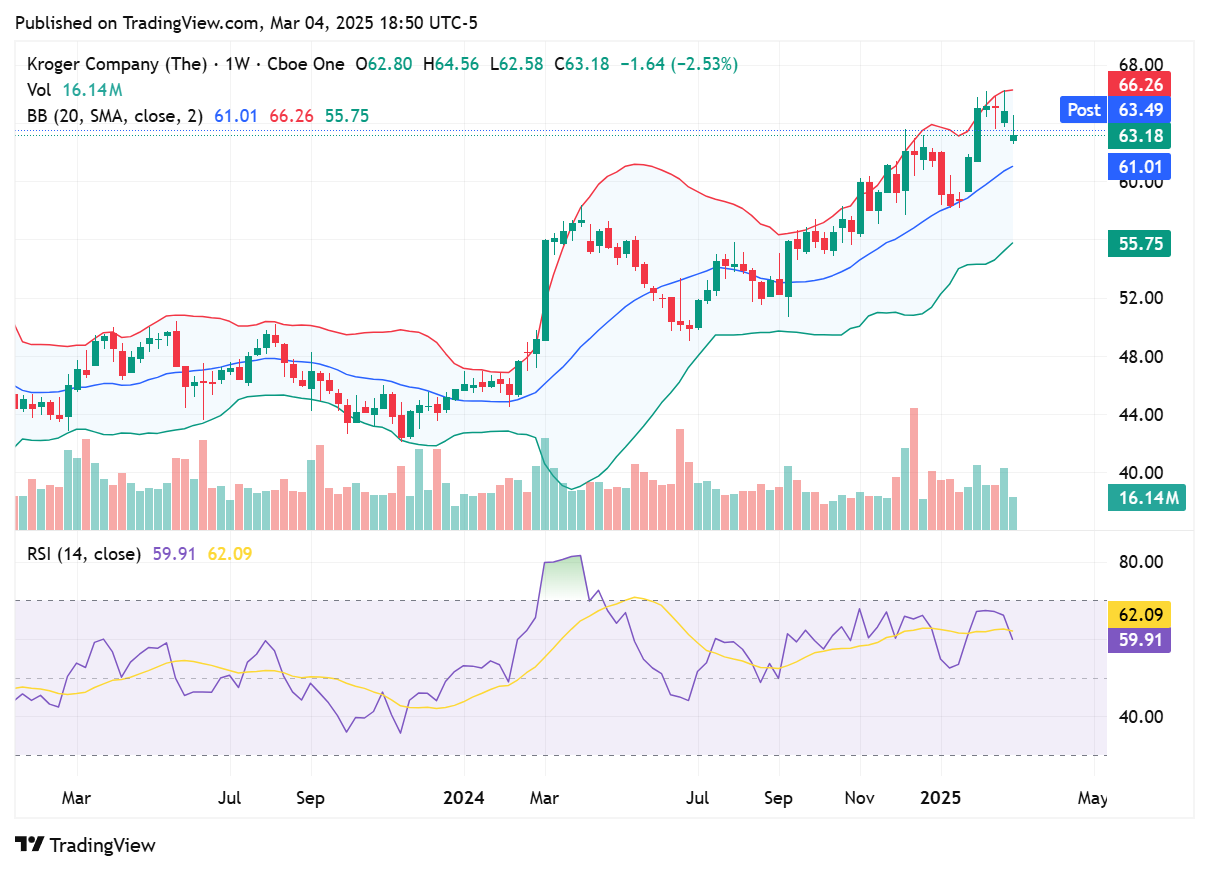
Weekly Chart
Moving Averages
8-day EMA: $64.01
20-day EMA: $63.92
Short-term moving averages indicate a sell signal, with the stock price below both the 8-day and 20-day SMAs, it generally indicates a short-term downtrend or bearish sentiment for the stock.
The 50-day EMA at $62.51 is above the current price, it generally indicates a bearish trend in the market.
100-day SMA: $60.29, it generally indicates a bullish trend in the medium term.
200-day SMA: $56.74, it generally indicates a bullish trend in the long term.
Oscillators and Momentum
The Relative Strength Index (RSI) (14,70,30)
Daily: 47.63, indicates a relatively neutral momentum for the stock.
Weekly: 59.91, indicates a moderately bullish sentiment in the market, but not yet at overbought levels. This value falls within the neutral range, suggesting that the asset is neither overbought nor oversold.
The Moving Average Convergence Divergence (MACD) (12,6,9)
Daily: 0.493, indicates a bullish sentiment in the short-term market trend
Weekly: 2.306,indicates a strong bullish trend in the medium-term market outlook. This positive value suggests that the 12-week exponential moving average (EMA) is significantly above the 26-week EMA, signaling robust upward momentum
The Commodity Channel Index (CCI) (14,-100,100)
Daily: -156.92, indicates a strongly oversold condition in the short-term market trend. This reading suggests that the asset's price is significantly below its average level, potentially signaling an extreme bearish sentiment.
Weekly: 54.39, indicates a moderately bullish sentiment in the medium-term market trend. This reading suggests that the asset's price is above its average level over the past several weeks, but not yet in overbought territory.
Price Action and Volatility
Bollinger Bands (Daily) : 63.54; 64.77; 66.35. When a stock closes below the lower Bollinger Band, it typically indicates an oversold condition.
Bollinger Bands (Weekly): 55.75; 61.01; 66.26,indicates moderately bullish sentiment.
Percent B (%b):
Daily: -0.105, This can be interpreted as follows:
Oversold condition
Potential buying opportunity: In an uptrend, this oversold condition might present a possible buying opportunity.
Strong downward momentum: The negative value indicates that the price has broken through the lower band, which could signal strong downward momentum.
Increased volatility: When prices move outside the bands, it often suggests an increase in volatility and potential for a trend reversal or continuation
Weekly: 70.68, suggests a moderately bullish sentiment,
Bandwidth:
Daily : 3.17, indicates a relatively narrow range between the upper and lower Bollinger Bands, suggesting low volatility in the market.
Weekly: 10.51, indicates an extremely high level of volatility in the market


