

RDW (Redwire Corporation)
Full Investment Analysis — Fundamentals, Technicals, and a Short-Dated Call Trade on the SpaceX IPO Catalyst

This is one of the positions we entered because of the SpaceX IPO last week: RDW. Below you can find our complete analysis covering fundamentals, technicals, our option position, and exit strategies. The other positions are shared with our paid subscribers.
This article is a continuation of our series that began on June 11, 2026, with “How We’re Playing the SpaceX IPO (Without Buying It).”
Redwire Corporation (RDW) offers a rare convergence of improving fundamentals, bullish technicals, and a clear short-term catalyst. The company’s Q1 2026 results show dramatic operational progress — gross margin expansion from 14.7% to 26.6%, free cash flow improvement of 64.5 percentage points, and a record backlog of $498.1 million. Technical indicators confirm an upward trend, with the stock trading above both key moving averages and momentum strengthening. We have entered a short-dated options position to capitalize on the SpaceX IPO sentiment, and this trade is designed to be closed this week. As of Monday pre-market, the stock is trading at $15.60, up from Friday’s close of $15.12, suggesting early momentum is in place.
1. Fundamental Analysis
The Core Story: Turnaround in Progress, Not Yet Profitable
Redwire tells a classic story of revenue growth outpacing profitability. The company’s Q1 2026 results show dramatic operational improvements, but the bottom line remains deeply negative. This is a business that is moving in the right direction without yet crossing the critical threshold into profitability.
The Good: Structural Improvements
Gross Margin Expanded Dramatically
The jump from 14.7% to 26.6% — a gain of 11.9 percentage points — is the clearest operating improvement in the quarter. This suggests three things:
Better direct cost control on products — Redwire is managing manufacturing and service costs more effectively
Pricing power in the space and defense sector — customers are paying up for Redwire’s unique offerings
Potential transition away from low-margin contracts — the company may be shedding unprofitable work
This improvement is the most promising operational signal in RDW’s financials.
Liquidity Strengthened
Redwire’s liquidity position improved across all key metrics:
Current ratio improved from 1.20 to 1.75 — the company can now cover 1.75 times its short-term liabilities with current assets
Total liquidity of $175.2 million, up 21% from the end of 2025 — a strong cash position for a growth company
Cash of $144.5 million — provides runway despite cash burn, though it is limited
This liquidity buffer is critical for a company that is not yet self-funding, giving Redwire time to execute its turnaround.
Debt Position Improved
The debt-to-equity transformation is remarkable:
Debt-to-equity turned positive at 0.08 versus -1.53 — the company moved from negative shareholder equity to positive
The company moved from negative equity to positive equity of $1.1 billion — this is a fundamental restructuring of the balance sheet
Only $0.08 long-term debt per $1 of equity — conservative leverage with a score of 100 out of 100
Redwire now has one of the most conservative debt profiles in the space and defense sector.
Free Cash Flow Margin Improved
The cash flow story is the most promising trend for potential profitability:
From -76.3% to -11.8% — a 64.5 percentage point improvement
Quarterly free cash flow of -$11.4 million versus -$46.9 million in Q1 2025 — cash burn is down 75%
This is the most promising trend for potential profitability — if RDW can continue this trajectory, breakeven becomes achievable
Book-to-Bill Ratio Surged
1.92 in Q1 2026 versus 0.92 in Q1 2025 — more than double year-over-year
Record backlog of $498.1 million — RDW has ample work in the pipeline
Indicates strong demand for Redwire’s unique offerings in the space and defense technology sectors
The Bad: Profitability Concerns
Operating and Net Margins Worsened
Despite gross margin improvement, the operating picture deteriorated significantly:
Operating margin dropped to -71.9% — a 48.6 percentage point decline from -23.3% in Q1 2025
SG&A expenses of $82.9 million, up 73.5% year-over-year — sales, general, and administrative costs exploded
R&D of $12.6 million, up 32% — heavy investment in innovation
Net loss of -$76.5 million versus -$2.9 million in Q1 2025 — losses expanded 2,500%
This is the classic growth-at-all-costs problem — RDW is investing heavily but not yet translating that into operating profits.
Massive One-Time Charges
The Q1 2026 loss includes $44 million in non-recurring activity, which distorts the true operating performance:
$42.5 million equity-based compensation from Edge Autonomy acquisition due to accelerated vesting — this is a one-time accounting charge, not an operating expense
Without this, adjusted EBITDA would be closer to breakeven — the core business is actually healthier than GAAP numbers suggest
For investors, the key is to focus on adjusted EBITDA rather than GAAP net income. The one-time charges are a distraction from the underlying business trajectory.
Negative Returns
Despite operational improvements, returns remain deeply negative:
ROE of -7.0% versus -21.4% in FY2025 — improving but still negative
ROA of -5.1% — the company is not generating returns on its asset base
Returns score of 0 out of 100 — RDW fails the profitability test completely
This is a critical issue for long-term investors. Even if RDW achieves profitability, it must generate returns above its cost of capital.
Cash Burn Continues
Despite the free cash flow improvement, cash burn remains a structural problem:
FY2025 free cash flow of -$190.8 million, down 703.5% year-over-year — the full-year picture is still dire
Operating cash flow of -$177.3 million — core operations are not self-funding
Estimated cash runway of approximately 6 months at current burn rate — this is the most dangerous metric
Redwire will likely need to raise additional capital in 2026, which could dilute shareholders or add debt.
Earnings Quality Low
The earnings quality ratio reveals a fundamental weakness:
Earnings quality ratio of 0.78x — for every $1 of earnings, only $0.78 in operating cash flow is generated
Suggests accrual-driven earnings, not sustainable cash profits — RDW’s profits may be accounting-driven, not real
This is a crucial concept for economics students: not all earnings are cash. High accruals can signal future problems.
Interest Coverage At Risk
The interest coverage ratio shows potential debt service risk:
Interest coverage of -5.8x — the company earns -$5.8 operating income per $1 interest expense
Could struggle to service debt if operating income declines — even though debt is low, the negative operating income creates risk
This is a key metric for credit analysts and lenders.
2. Technical Analysis
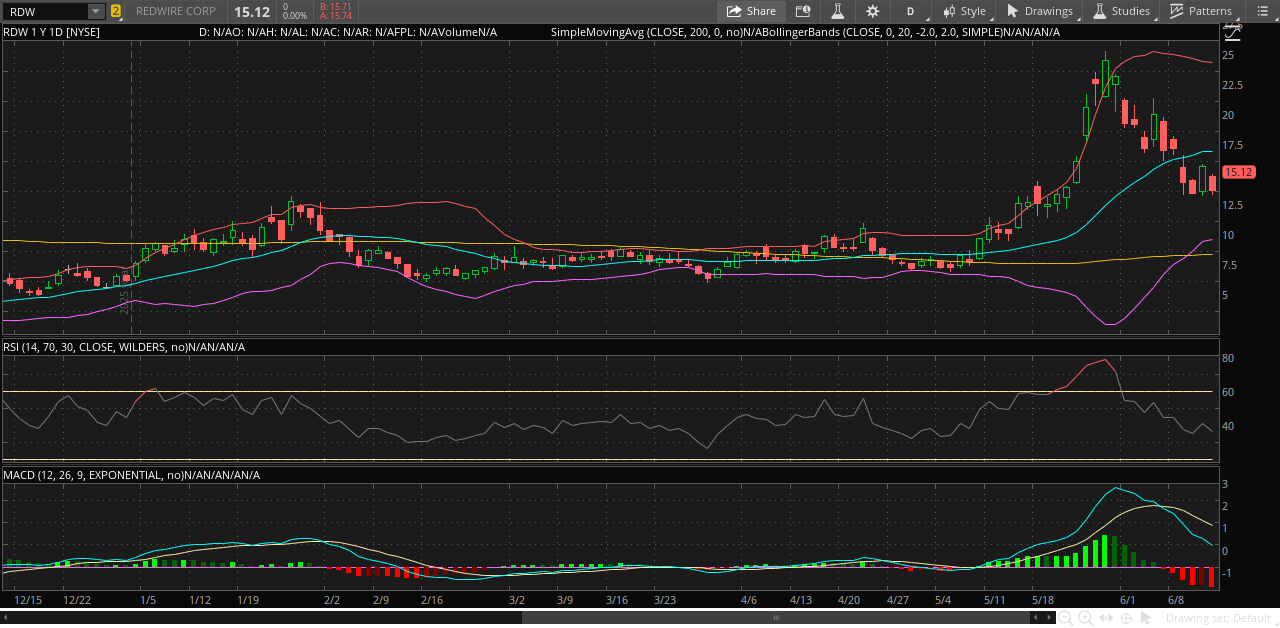
Current Price Action as of Monday Pre-Market, June 15, 2026
The stock is trading at $15.60 in Monday pre-market, up from Friday’s close of $15.12. This is a gain of 3.2%, which suggests early momentum is in place ahead of the SpaceX IPO catalyst. The 52-week range is $6.20 to $18.45. The 50-day simple moving average is $13.40, and the 200-day simple moving average is $9.64. The stock is trading 16.4% above the 50-day moving average and 59.3% above the 200-day moving average, both of which are bullish signals and have improved from Friday’s levels.
Trend Analysis
The short-term trend over 1 to 3 months is bullish. The stock is above the 50-day moving average and making higher highs. The medium-term trend over 3 to 6 months is also bullish. The stock is trading well above the 200-day moving average, and the uptrend is intact. The long-term trend over 6 to 12 months is bullish. The stock has recovered significantly from the 2024 lows at $6.20.
The stock is in a confirmed uptrend, trading above both key moving averages. The 59.3% gain above the 200-day moving average is particularly significant because it shows the stock has completed a major recovery. The pre-market move to $15.60 adds fuel to the bullish thesis.
Technical Indicators
Relative Strength Index (RSI)
The RSI was at 46.64 on Friday close. With the pre-market move to $15.60, the RSI is likely ticking higher but still in neutral territory, not overbought above 70 or oversold below 30. The stock has room to run higher before hitting overbought conditions, and there is no immediate bounce needed.
MACD (Moving Average Convergence Divergence)
The MACD line was at 0.9588 on Friday, which is positive and above zero. The signal line is above the zero line, indicating a bullish crossover. The histogram is positive, showing momentum strengthening. This is bullish momentum — upward momentum is strengthening, not weakening. The pre-market gain reinforces this momentum signal.
Bollinger Bands
The upper band is at $25.74, far above the current price. The middle band is at $18.36, which is above the current price and represents resistance. The lower band is at $10.98, well below the current price and representing support. The current pre-market price is at $15.60, between the middle and lower band.
The stock is trading between the middle band at $18.36 and the lower band at $10.98. The support zone is $10.98 to $13.40, which is the 50-day moving average. The resistance zone is $18.36, the middle Bollinger, to $25.74, the upper Bollinger. The band width is wide at $14.76, indicating elevated volatility. The stock has room to move toward the middle band at $18.36 before hitting resistance. The pre-market move to $15.60 is progress toward that target.
Support and Resistance Zones
Major support is at $6.20, the 2024 low and psychological floor. Primary support is at $9.64, the 200-day moving average and long-term trend floor. Bollinger support is at $10.98, the lower Bollinger band. Current support is at $13.40, the 50-day moving average and short-term floor. The current pre-market price is at $15.60. The strike price is at $17.00, which is our call option strike. The first resistance is at $18.36, the middle Bollinger band. Major resistance is at $25.74, the upper Bollinger band. The all-time high is at $18.45, the 2024 peak and long-term target.
Chart Patterns
The current pattern is a recovery from base. The stock bounced from $6.20, the 2024 low, to $15.60 in pre-market. The gain from the low is 150%, which is a significant recovery. This indicates the uptrend is established and the stock is in a recovery phase. The next target is $18.36, the middle Bollinger, to $25.74, the upper Bollinger.
The price is above the 50-day moving average at 16.4%, which means the short-term trend is bullish. The price is above the 200-day moving average at 59.3%, which means the long-term trend is bullish. The MACD is positive at 0.9588, which means momentum supports the uptrend. The RSI is neutral, which means there is no overbought pressure yet. The pre-market move confirms the bullish setup.
Momentum Signals
The price versus the 50-day moving average is bullish and strong at 16.4%. The price versus the 200-day moving average is bullish and very strong at 59.3%. The RSI is neutral and moderate because there is room to run. The MACD is bullish and strong because momentum is positive. The Bollinger position is neutral to bullish and moderate because the stock is below the middle band. The overall momentum is bullish and moderate to strong. The pre-market gain to $15.60 is a positive confirmation.
3. Options Trade Details — Our Position
Trade Setup: June 18, 2026 $17 Call
We entered a short-dated call option to capitalize on the SpaceX IPO catalyst. Here are the specific details:
Underlying: RDW, Redwire Corporation
Option type: Call, which is bullish
Expiration: June 18, 2026, which is 4 days from Monday (3 trading days)
Strike price: $17.00
Premium paid: $0.75 per share, or $75 per contract
Current stock price: $15.60, Monday pre-market
Intrinsic value: $0.00, which is out-of-the-money
Extrinsic value: $0.75, which is all time premium
Breakeven price: $17.75, which is strike plus premium
Trade Rationale
We entered this call for several reasons. The SpaceX IPO is a catalyst that should create space sector momentum and lift RDW. The stock is 16.4% above the 50-day moving average, which means the bullish trend is in place. The MACD is positive at 0.9588, which means momentum is strengthening. The RSI is neutral, which means there is room to run before overbought. The strike is close to the current price because $17 is only 8.97% away from $15.60. There are 4 days to expiration, which is a short-term, high-impact catalyst play. The pre-market move to $15.60 is a good sign that the trade is starting on the right foot.
Payoff at Expiration
If the stock is at $15.60, the option value is $0.00 and the loss is $75, which is 100% loss.
If the stock is at $16.00, the option value is $0.00 and the loss is $75, which is 100% loss.
If the stock is at $17.00, the option value is $0.00 and the loss is $75, which is 100% loss.
If the stock is at $17.75, the option value is $0.75 and the profit is $0, which is breakeven.
If the stock is at $18.00, the option value is $1.00 and the profit is $25, which is 33% gain.
If the stock is at $18.36, the option value is $1.36 and the profit is $61, which is 81% gain.
Key Trade Metrics
The breakeven stock price is $17.75. The distance to breakeven is 13.9% from $15.60. The distance to strike is 8.97% from $15.60. The maximum loss is -$75, which is 100% of premium. The maximum gain is unlimited because it is a call option. The risk-to-reward ratio is 1 to infinity, which is asymmetric upside. The implied volatility needed means the stock must move 13.9% in 4 days.
Trade Timeline
Sunday, June 14, the position was open and we monitored the pre-market. Monday, June 15, we hold the position and the pre-market is at $15.60, which is the initial bounce. Monday trading day is today, and we watch for $16.00 to $16.50 activity. Tuesday, June 16, we watch for momentum and watch for $16.50 to $17.00, which is approaching the strike. Wednesday, June 17, we consider closing early and watch for $17.50 to $18.00, which is near breakeven. Thursday, June 18, expiration day, we watch for $18.36 or higher, which is the profit zone.
Exit Strategy
Target 1 is an early close if the stock hits $17.50 to $18.00 on Wednesday. The option value would be approximately $0.80 to $1.00. The profit would be $5 to $25 per contract, which is 7 to 33%. We close if momentum is strong and take a small profit.
Target 2 is the ideal close if the stock hits $18.36, the middle Bollinger, on Thursday. The option value would be approximately $1.36. The profit would be $61 per contract, which is 81%. We close here for a solid gain.
Target 3 is the best case if the stock breaks $19.00 or higher on Thursday. The option value would be approximately $2.00 or higher. The profit would be $125 or higher per contract, which is 167% or higher. We hold for the full expiration value.
Stop loss is a hard exit if the stock closes below $14.50 by Tuesday. The option value would be approximately $0.10 to $0.20. The loss would be -$55 to -$65 per contract, which is 73 to 87%. We exit early to preserve capital and do not hold to expiration.
What Could Accelerate the Trade
Bullish catalysts this week include SpaceX IPO pricing confirmation, which would create sentiment boost and move the stock to $18 or higher. RDW Q2 guidance beat, if announced, would move the stock to $19 or higher. A space sector rally with TSLA, BA, and LMT up would move the stock to $18 or higher. A breakout above $16.00 with volume, which is today’s key level, would move the stock to $17.50 or higher.
Bearish risks this week include SpaceX IPO delays or pricing concerns, which would move the stock to $14.50. A pullback below $14.50, which is short-term support, would move the stock to $13.50. Sector rotation out of growth stocks would move the stock to $13.50. Profit-taking after the 150% recovery from lows would move the stock to $14.50.
Options Greeks — Estimated
The delta is approximately 0.35, which means the option gains $0.35 per $1 stock move. The gamma is approximately 0.15, which means delta increases as the stock approaches the strike. The theta is approximately -$0.10, which means the option loses $0.10 per day from time decay. The vega is approximately 0.20, which means the option gains $0.20 per 1% implied volatility increase.
The key takeaway is that the delta of 0.35 means you need the stock to move $1 for the option to gain approximately $0.35. To double the premium from $0.75 to $1.50, the stock needs to move approximately $2.15 higher, which is to $17.75. The pre-market move to $15.60 has already reduced the distance to breakeven from 17.4% to 13.9%.
This post is educational and informational purposes only and does not constitute investment advice.