Ross Stores, Inc. ROST
Fundamental and Technical Analysis before Earnings Release
Ross Stores, Inc. (NASDAQ: ROST) will release its fourth quarter and fiscal 2024 earnings results today, March 4, 2025, at approximately 4:00 p.m. Eastern Time. A conference call with a real-time audio webcast will follow at 4:15 p.m. Eastern Time, accessible through the Investors section of the company's website.
As of March 2025, Ross Stores, Inc. operates a total of 2,192 locations across 43 states, the District of Columbia, and Guam. This total includes both Ross Dress for Less and dd's DISCOUNTS stores.
There are 1,836 Ross Dress for Less locations in the United States. Ross Stores continues to expand, with plans to grow to at least 2,900 Ross Dress for Less locations over time. The company has been steadily increasing its store count, demonstrating strong growth in the off-price retail sector.
Fundamental Analysis of ROST
Ross Stores, Inc. last released its earnings results on November 16, 2024. The company reported the following key financial data:
Revenue: $5.28 billion, representing a 3.0% year-over-year increase.
Net Income: $504 million, a 9.3% increase from the previous year.
Earnings Per Share (EPS): $1.53, up from $1.38 in the same quarter last year.
Profit Margin: 9.6%, consistent with the previous year.
Financial Projections
Projected revenue for fiscal year 2025: $21.168 billion
Projected net income for fiscal year 2025: $2.048 billion
Projected earnings per share (EPS) for fiscal year 2025: $6.19
Growth Expectations
Projected revenue growth of 3.88% compared to fiscal year 2024
Projected net income growth of 9.27% compared to fiscal year 2024
Long-term Growth Forecasts
Earnings Growth: Projected at 6.8% per annum over the next three years.
Revenue Growth: Expected to increase by 5.4% per annum.
EPS Growth: Forecast to grow by 8.6% per annum.
Return on Equity: Projected to be 39.7% in 3 years.
Additional Financial Moves
Stock Repurchase Program: A new two-year $2.1 billion program announced for fiscal years 2024 and 2025.
Dividend Increase: 10% increase in quarterly dividend to $0.3675 per share.
Technical Analysis of ROST
Here's a breakdown of key technical indicators:
Moving Averages
8-day EMA: $137.7
20-day EMA: $140.66
Short-term moving averages indicate a sell signal, with the stock price below both the 8-day and 20-day SMAs, it generally indicates a short-term downtrend or bearish sentiment for the stock.
The 50-day EMA at $144.4 is above the current price, it generally indicates a bearish trend in the market.
100-day SMA: $146.42, it generally indicates a bullish trend in the medium term.
200-day SMA: $146.04, it generally indicates a bullish trend in the long term.
Oscillators and Momentum
The Relative Strength Index (RSI) (14,70,30)
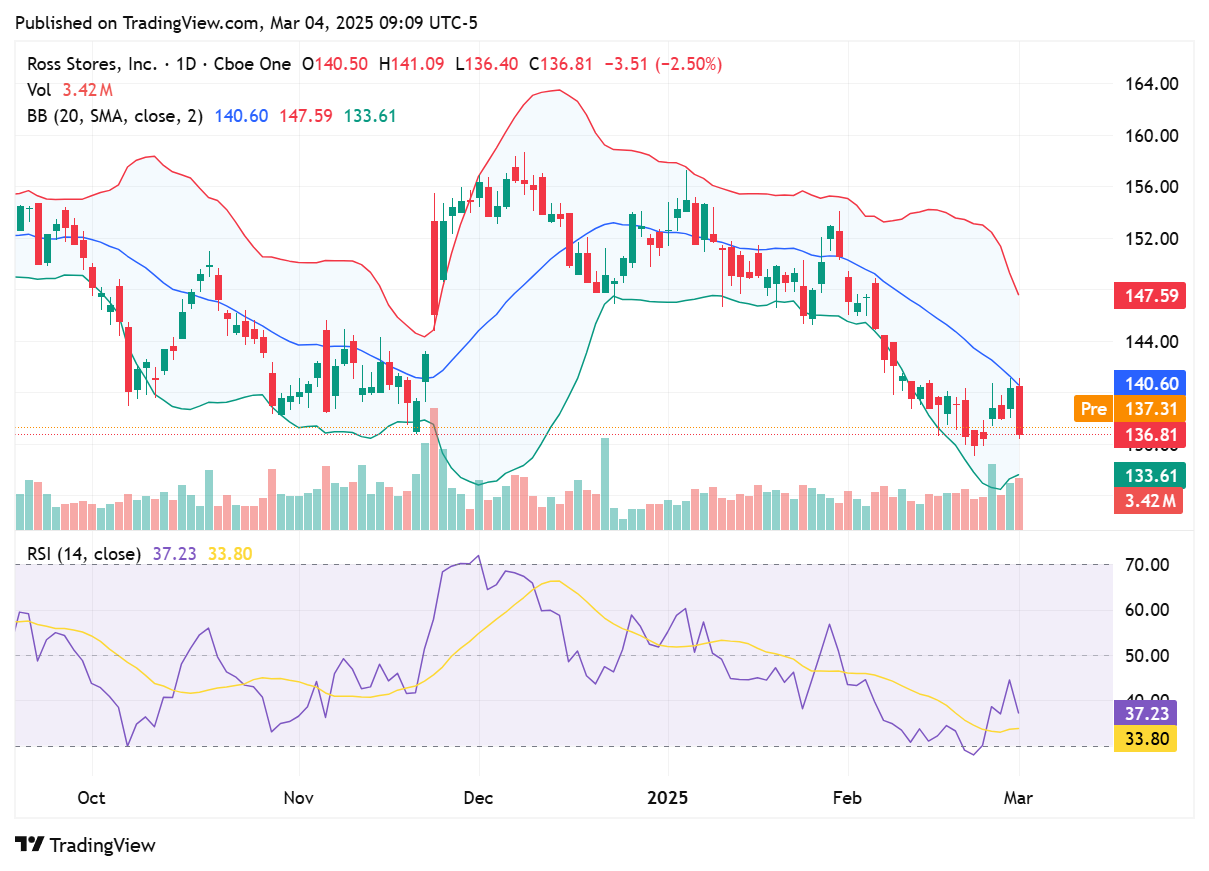
Daily: 37.23, indicates that the asset is currently in a neutral to slightly bearish territory.
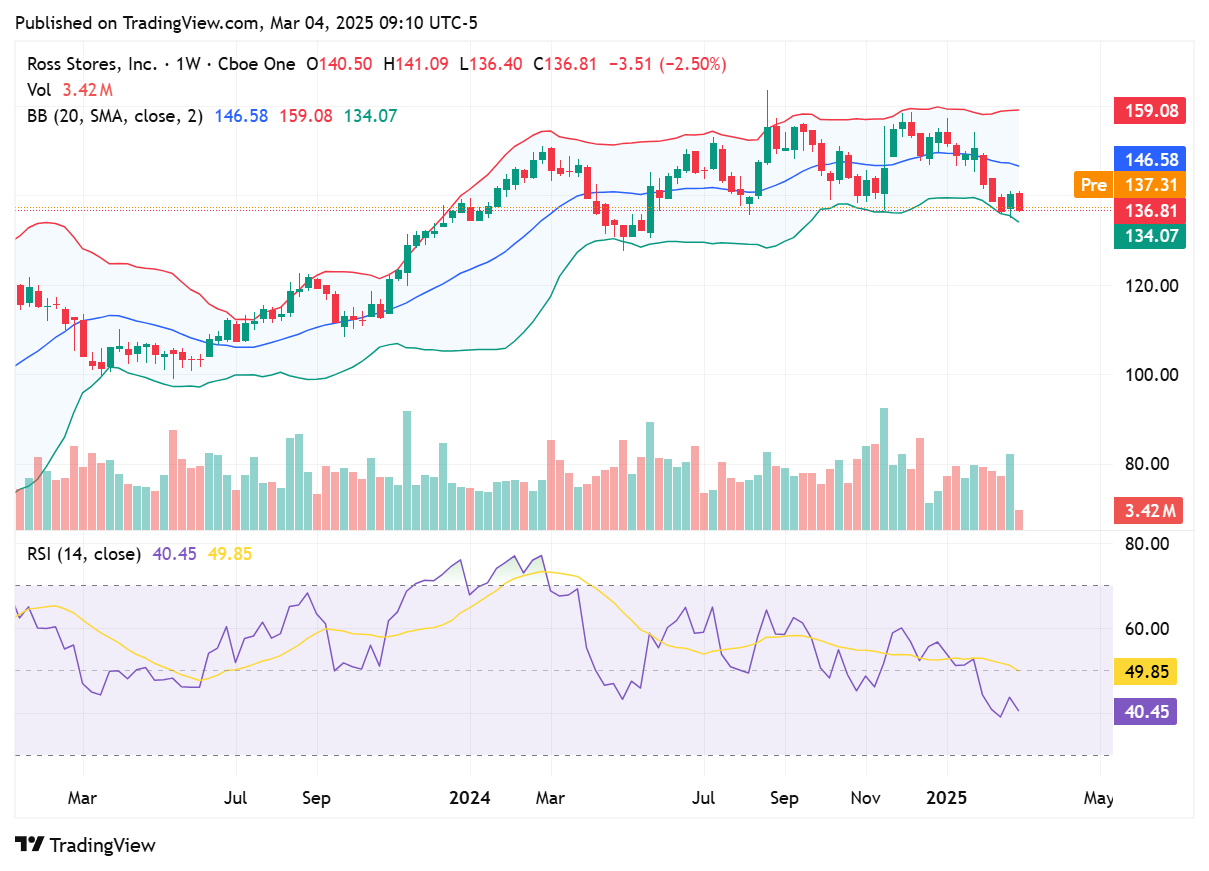
Weekly: 40.45, indicates a neutral to slightly bearish momentum on a longer-term timeframe.
The Moving Average Convergence Divergence (MACD) (12,6,9)
Daily: -2.74, indicates bearish momentum in the short term.
Weekly: -1.73, indicates bearish momentum on a longer-term timeframe.
The Commodity Channel Index (CCI) (14,-100,100)
Daily: -41.88, suggests a mild bearish sentiment, but it's not a strong signal on its own.
Weekly: -115.25, suggests the asset is in an oversold condition, potentially signaling a strong downtrend or a possible buying opportunity if a reversal occurs
Price Action and Volatility
Bollinger Bands (Daily) : 133.61; 140.6; 147.59
Bollinger Bands (Weekly): 136.81; 146.58; 159.08
Price position: The stock price is closer to the lower Bollinger Band than the upper band, suggesting downward pressure, both daily and weekly.
Percent B (%b):
Daily: 22.88, indicates that the current price is relatively close to the lower Bollinger Band, suggesting a mildly bearish sentiment.
Weekly: 10.95, indicates that the current price is very close to the lower Bollinger Band, suggesting a strongly bearish sentiment.
Bandwidth:
Daily : 13.98, indicates a moderate level of volatility in the market
Weekly: 22.27, indicates a moderate level of volatility.


