Stock market valuation
Tobin's Q and Buffett Indicator

In this article, we examine two widely used indicators for assessing stock market valuation: Tobin's Q and the Buffett Indicator. Both metrics aim to determine whether the stock market is overvalued relative to economic fundamentals.
Q Ratio (Tobin's Q)
The Q Ratio is the ratio between a physical asset's market value and its replacement value. It was introduced by Nicholas Kaldor in 1966 and later popularized by James Tobin
Formula: Q Ratio = Market Value of Assets / Replacement Cost of Assets
Interpretation:
Q < 1: Assets are undervalued
Q > 1: Assets are overvalued
Q = 1: Assets are fairly valued
Applications:
For a company, a common approximation is:
Tobin′s q= (Total Equity Market Value + Total Liabilities Market Value) / (Total Equity Book Value + Total Liabilities Book Value)
Corporate Investment: High q values (>1) encourage companies to invest in capital assets.
Market Valuation: Used to assess whether individual stocks or the entire stock market is overvalued or undervalued.
Economic Analysis: Can be calculated for aggregate corporations to evaluate overall market valuation.
As of January 2025, the latest Q-ratio is 1.84, indicating that the market is significantly overvalued. The current Tobin's Q value o is well above its historical median of 0.76 and typical range of 1.13 to 1.73. This further supports the notion of market overvaluation.
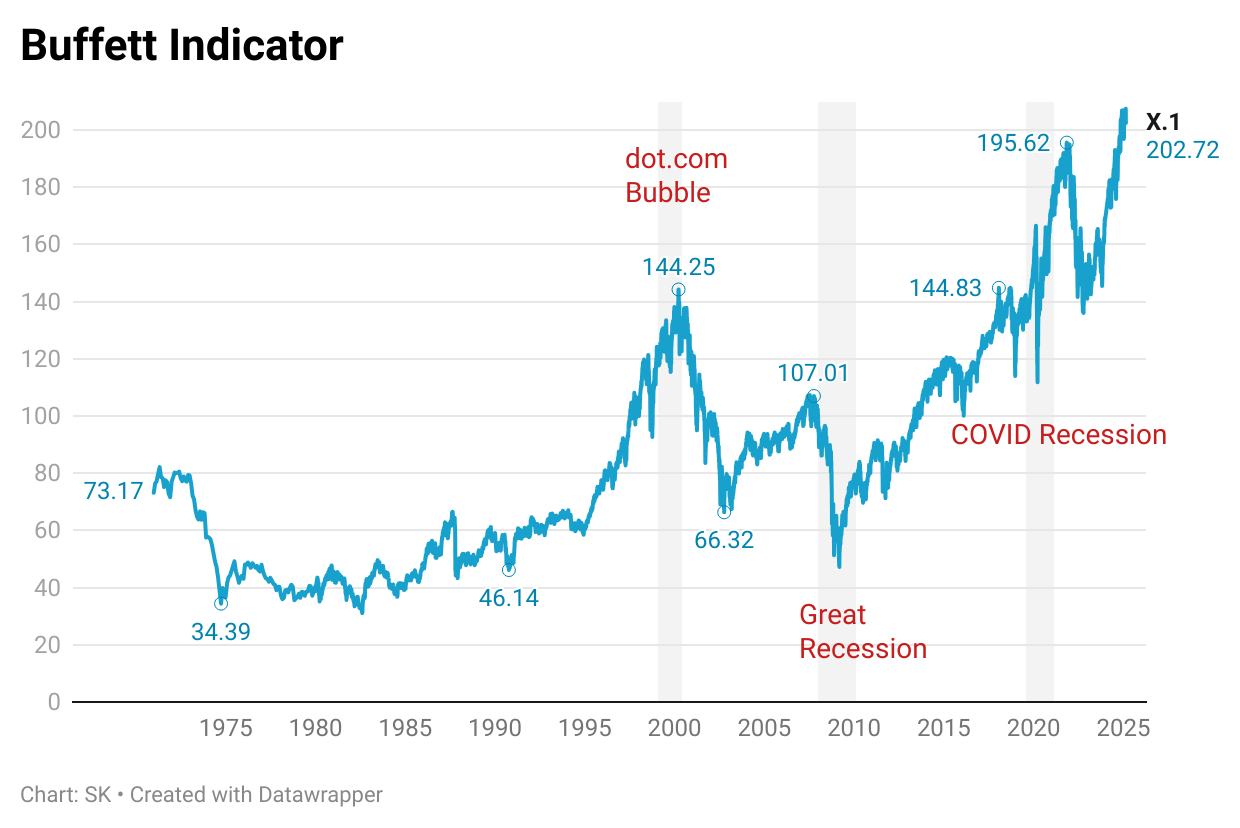
Buffet Indicator
The Buffett Indicator, also known as the Market Cap-to-GDP ratio, is a financial metric used to assess the overall valuation of a stock market. Named after legendary investor Warren Buffett, who called it "probably the best single measure of where valuations stand at any given moment," this indicator compares the total market capitalization of a country's stock market to its Gross Domestic Product (GDP).