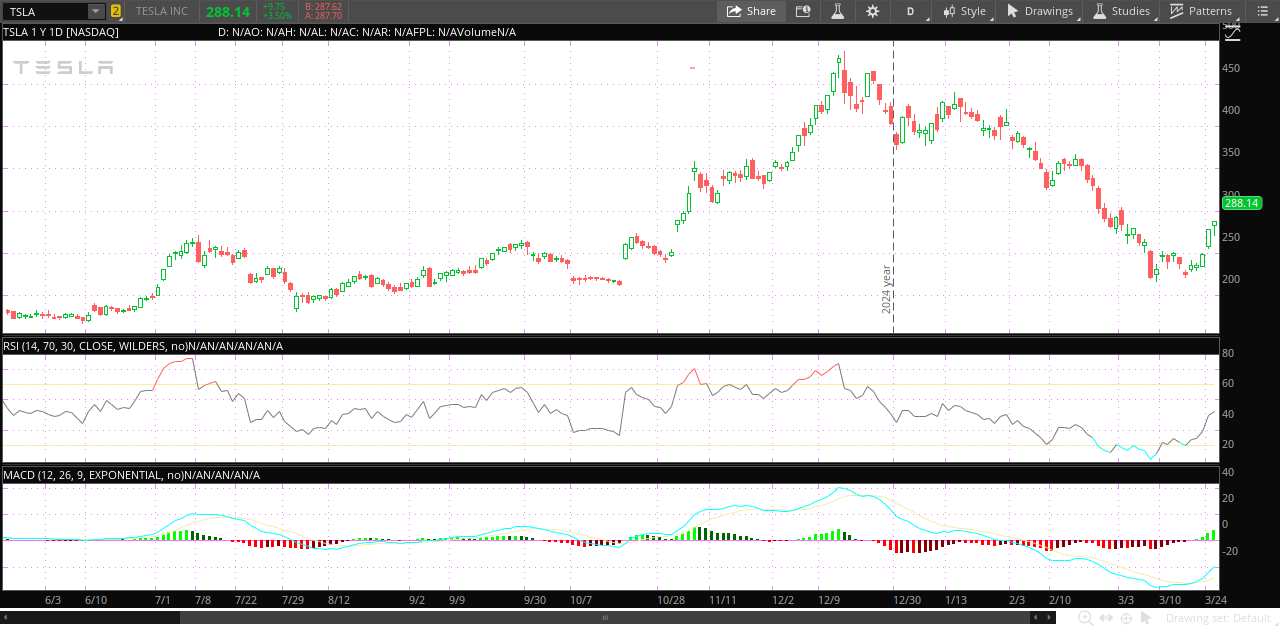
Technical Analysis of TSLA

Given the significant price fluctuations in Tesla stock, we will conduct a technical analysis to better understand its current market dynamics.
Price Action and Volatility
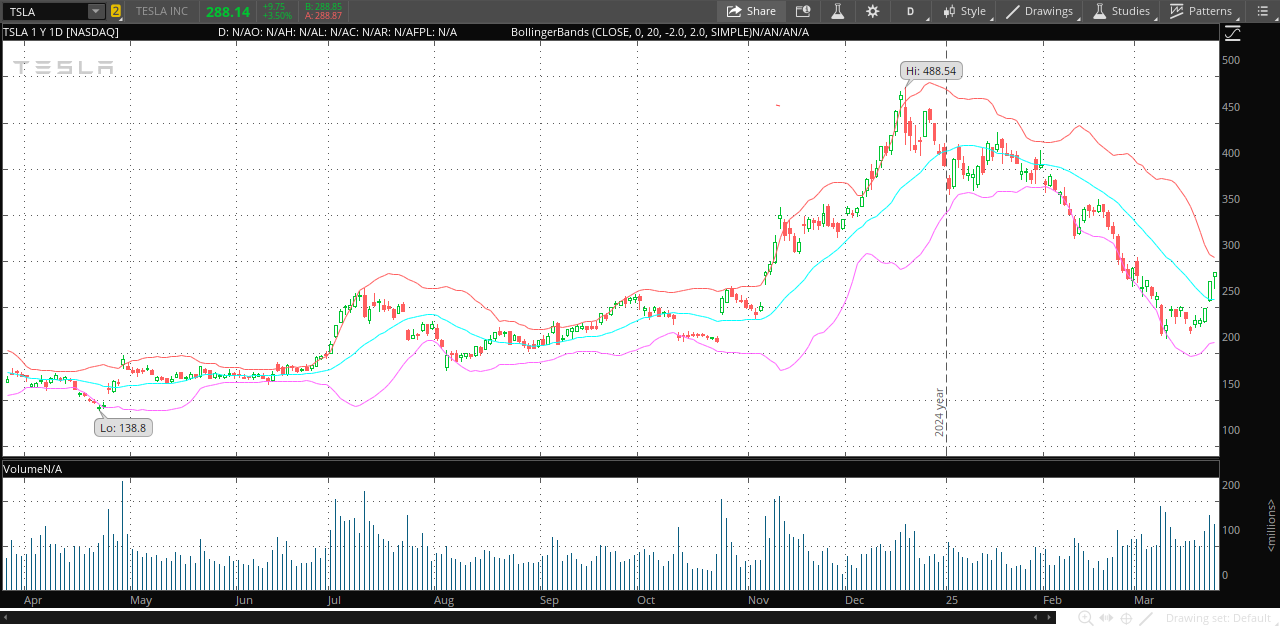
Bollinger Bands
212.42; 258.49; 304.56
The current stock price is 288.14, which is positioned as follows:
The stock price is above the middle band (258.49), indicating an overall bullish trend.
The price is closer to the upper band (304.56) than the lower band, suggesting strong upward momentum.
While the price is near the upper band, it has not yet touched or exceeded it, which means the stock is not necessarily overbought at this point.
The width of the bands (difference between upper and lower) is 92.14, indicating relatively high volatility in the stock's recent price action.
There's still some room for potential upward movement before the price reaches the upper band, which could be seen as a short-term resistance level.
If the price continues to rise and touches or exceeds the upper band, it might signal a potential overbought condition or a forthcoming price reversal.
The middle band (258.49) may now act as a support level if the price experiences a pullback.
Bollinger Percent B (%b)
The current %B level of 82.1775 reflects that Tesla's stock is trending upward strongly, but traders should watch for signs of reversal or consolidation near the upper band.Readings above 80 often indicate overbought conditions, implying that the stock may be nearing a short-term resistance level or could be due for a pullback. However, sustained high %B values can confirm a breakout or continuation of an uptrend.
Resistance Levels
Upper Bollinger Band: 304.56
Short-term resistance: 288.20 (current day's high)
Medium-term resistance: 309.05
Long-term resistance: 488.54 (52-week high)
Fibonacci Resistance Levels: 38.2% Retracement: 270.52, 50% Retracement: 275.79
61.8% Retracement: 281.16 and 78.6% Retracement: 289
Descending channel top (3-4 month timeframe): 301.73
Potential target if above levels (except long-term resistance) are breached: 387.76
Support Levels
Lower Bollinger Band: 212.42
Short-term support: 271.28 (current day's low)
Medium-term support: 235.86
Long-term support: 138.80 (52-week low)
Fibonacci support levels: 231.92, 231.15, 229.90
Critical 2-year channel bottom: 258.99
Long-term support zone (5-year channel bottom) : 154.05 to 160.60
Moving Averages
8-day EMA: 258.97. strong short-term bullish trend. However, such a large gap between the price and the short-term EMA might indicate that the stock is becoming overbought and could be due for a pullback.
20-day EMA: strong bullish trend in the short to medium term
50-day EMA: bearish trend in the medium term.The 50-day EMA at 307.04 may now act as a resistance level if the price attempts to move higher.
100-day SMA: strong bearish trend in the medium to long term
200-day SMA: Neutral to bullish long term signal. However, since the stock is only marginally above the 200-day SMA, it suggests that the trend may still be at a turning point and not fully confirmed as bullish.